One observability layer
Dashboards, fleet and host views, service monitoring, telemetry, alerting, synthetics, incidents, and cloud actions, aligned to how you operate, not siloed by tool.
All platform modules
CloudPilot Monitoring gives teams a single place to observe infrastructure, hosts, services, and application behaviour, without juggling separate tools for metrics, tracing, alerts, and operational visibility.
A multi-tenant observability platform that combines dashboards, fleet and host views, service-level monitoring, live telemetry, alerting, synthetics, incidents, remediation, audit trails, and cloud actions in one connected experience.
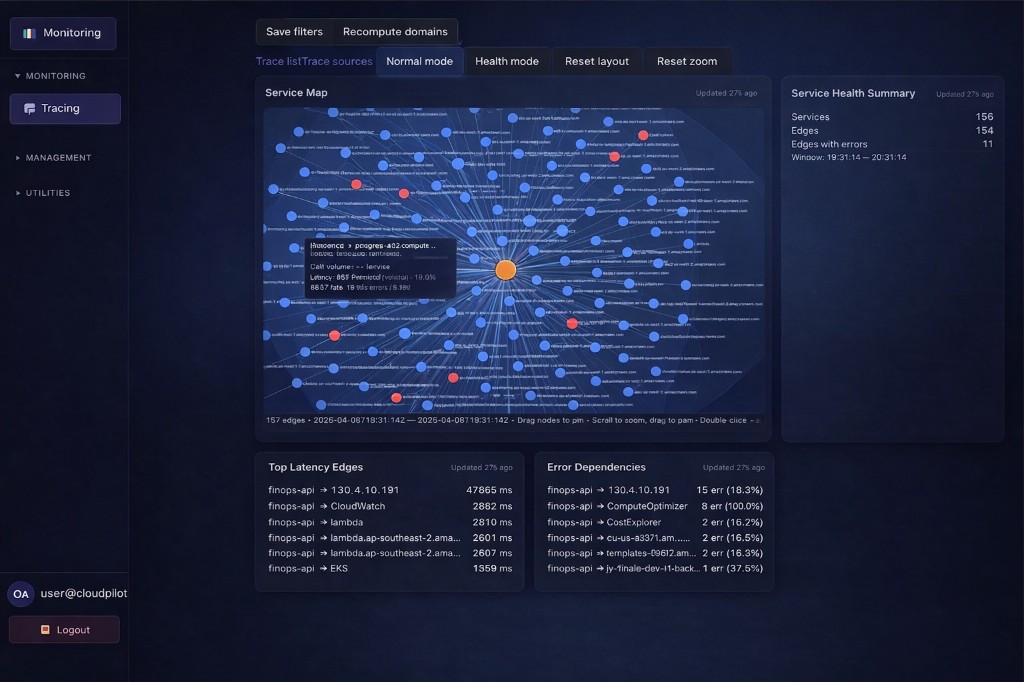
Service Map turns distributed traces into a living dependency graph of your services and downstream dependencies over a chosen time window, giving teams a clear view of who calls whom, how often those interactions happen, and how healthy those connections are.
Instead of relying on diagrams maintained by hand, Service Map is built from real traced traffic, helping teams understand system behaviour as it actually happens.
Built from distributed traces
Live telemetry and health in context
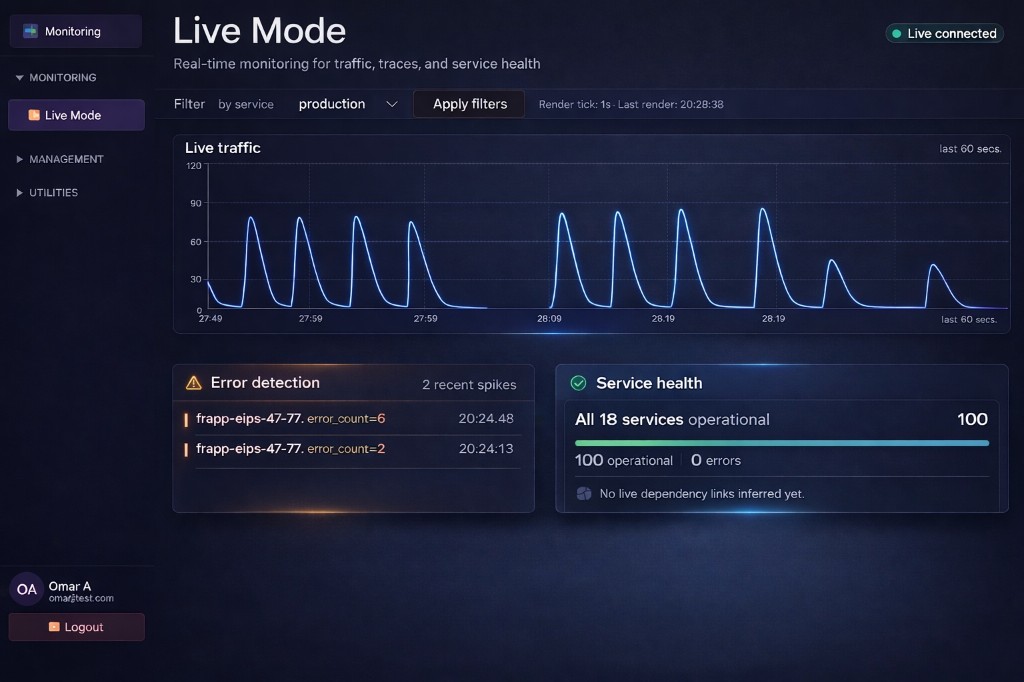
Live Mode provides a near real-time operational view of traffic, error spikes, service health, and changing service relationships, helping teams move beyond static dashboards to a more active and current picture of platform behaviour.
It brings together several complementary signals in one screen, including a request-rate timeline showing activity over recent seconds, error spikes surfaced from the live stream, per-service health summaries covering trace volume, metrics activity, errors, approximate error rates, and last-seen times, as well as a lightweight relationship panel that reflects changing dependencies as new interactions appear.
This is especially useful during incidents, traffic shifts, or service rollouts when teams need to quickly understand how the platform is behaving and which services are affecting one another.
Connect metrics, traces, alerts, and actions so teams understand what is happening across the environment and respond faster, with confidence.
Dashboards, fleet and host views, service monitoring, telemetry, alerting, synthetics, incidents, and cloud actions, aligned to how you operate, not siloed by tool.
Dependency and latency context from real trace data: who calls what, where time is spent, and which downstream paths drive errors.
Near real-time traffic, error spikes, service health, and evolving relationships, so operations can see the platform as it behaves now, not only in yesterday’s charts.
Audit trails and remediation paths that sit alongside the rest of CloudPilot, so monitoring connects to ownership, policy, and action, not just dashboards.
Bring metrics, traces, and health signals into one multi-tenant layer tied to services, hosts, and tenant boundaries your teams already recognise.
Use trace-backed relationships to see how components interact, where latency accumulates, and which dependencies show up in incident paths.
Watch traffic, errors, and service health update in near real time so triage and response start from a current picture, not a stale export.
Book a demo to explore Service Map, Live Mode, and how CloudPilot keeps operational visibility aligned with governance and ownership across your cloud.