When alerts don’t translate into outcomes
Most organisations already have some form of monitoring in place. In many cases, teams use multiple tools across infrastructure, applications, cloud services, logs, dashboards and team channels. Alerts may be sent into email inboxes, Slack or Microsoft Teams channels, ticketing systems, or dedicated monitoring platforms.
The challenge is not always the lack of monitoring. The real challenge is what happens after an alert is generated.
In many businesses, alerts are created but not consistently acknowledged, owned, investigated or acted on. Over time, teams can become used to alerts appearing in shared channels, especially when there is a high volume of noise or repeated warnings that do not lead to immediate action. This can create alert fatigue, where important signals are missed or ignored until they become serious incidents.
For business stakeholders, the problem is even more difficult. Metrics, thresholds, dashboards and technical alerts do not always clearly explain business impact. A CPU spike, latency increase, failed health check or storage warning may be visible to engineers, but it may not be clear to the wider organisation what it means, who needs to respond, or how urgent the issue really is.
As a result, many teams only react when the problem becomes a showstopper, when a service goes down, users are affected, revenue is at risk, or operations are disrupted.
This makes monitoring not only a tooling problem, but also a people and process problem. Engineers need the right context to understand the alert, identify ownership, assess impact and take action quickly. Leaders need confidence that critical issues are being surfaced, understood and followed through before they become business-critical incidents.
Monitoring can tell a team that something is wrong. The harder part is making sure the right people understand what it means, why it matters, and what needs to happen next.
What monitoring tools do well
Modern monitoring tools are essential to cloud operations. They provide the foundational visibility teams need to understand how systems are behaving in real time.
They are highly effective at collecting and presenting:
- Metrics such as CPU, memory, latency and throughput
- Logs that capture detailed system and application activity
- Alerts that notify teams when thresholds are breached
- Health signals that indicate the availability and performance of services
These capabilities allow engineering teams to detect issues early, track performance over time, and maintain a baseline understanding of system health.
Monitoring platforms are particularly strong at answering questions such as:
- What is happening right now?
- When did this issue start?
- Which system or component is affected?
This level of visibility is critical, and most organisations rely on it daily to operate their infrastructure.
The limitation
However, while monitoring tools are effective at surfacing signals, they are not always designed to provide full operational context.
They can tell you that something is wrong, but not always:
- Who owns the affected service
- What the business impact is
- How the issue relates to cost or usage
- Whether this is part of a wider system dependency or failure
As a result, teams often need to leave the monitoring tool and look elsewhere for answers.
What’s missing from monitoring today
Monitoring tools provide strong visibility into system behaviour, but they do not always bring together the broader operational context needed to take confident action.
When an alert is triggered, the technical signal is usually only the starting point. A dashboard may show that latency has increased, CPU usage is high, a service is unhealthy, or an endpoint is failing. But before a team can respond properly, they still need to understand the wider picture.
They need to know who owns the affected service, what systems depend on it, whether customers or internal users are impacted, and whether the issue carries any financial, operational or compliance risk. They may also need to understand whether something changed recently, such as a deployment, infrastructure update, configuration change or scaling event.
These answers are rarely available in one place.
In practice, engineers often move between monitoring dashboards, cloud consoles, ticketing systems, documentation, spreadsheets, chat channels and internal knowledge to piece together the full story. During an incident, this creates unnecessary delay and pressure. The team may be able to see that something is wrong, but still struggle to understand who should respond, how serious it is, and what action should come next.
This is where monitoring becomes more than a technical challenge. It becomes a coordination challenge.
Without connected context, alerts can sit in channels without clear ownership. Issues can be acknowledged too late. Teams can duplicate effort or investigate the wrong area. Leaders may only become aware once the issue has already affected users or business operations.
This slows down response times, increases cognitive load, and creates uncertainty during critical moments.
More importantly, it creates a gap between detecting an issue and understanding what it means.
The CloudPilot approach
Monitoring tools provide the signal. CloudPilot focuses on what happens next.
Instead of treating alerts as isolated events, CloudPilot connects monitoring signals with the wider operational context required to understand and act on them.
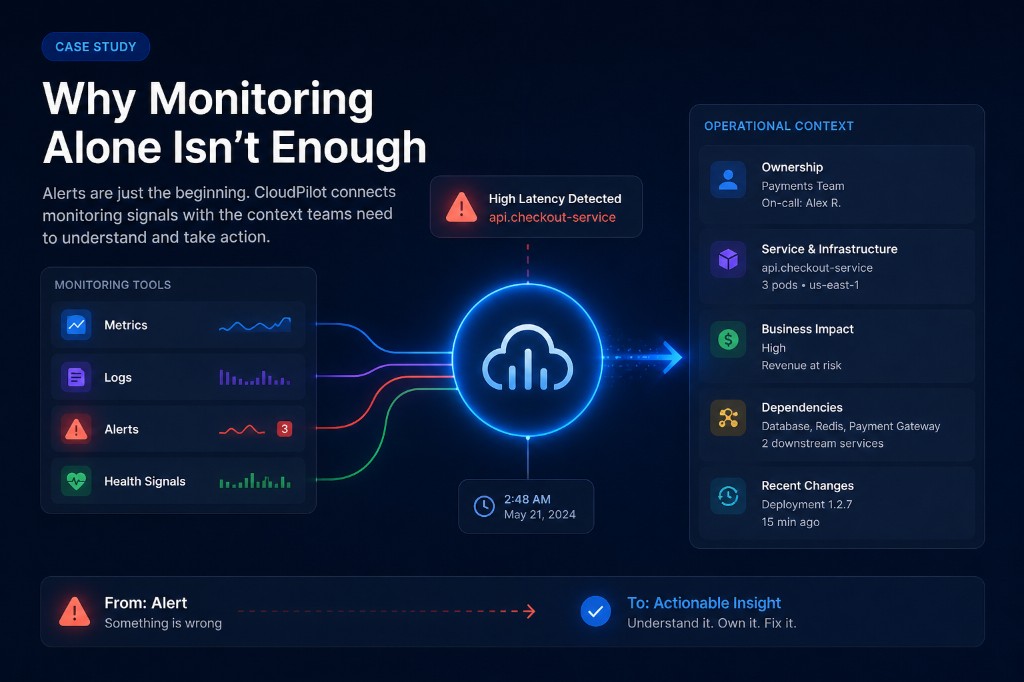
When an alert is triggered, it is no longer just a metric or threshold breach. It is connected to:
- The service and infrastructure involved
- The team or owner responsible
- The cost and resource impact
- Related systems and dependencies
- Recent changes that may have caused the issue
This allows teams to move from simply reacting to alerts to truly understanding them.
Rather than switching between tools to gather information, engineers can see the broader picture in one place. This reduces the time spent investigating and increases confidence in the actions being taken.
CloudPilot does not replace monitoring tools. It builds on them, acting as a connected intelligence layer across cloud operations.
Rethinking monitoring in modern cloud environments
Monitoring remains a critical part of modern cloud operations. It provides the signals teams rely on to detect issues, track performance and maintain system health.
However, as cloud environments grow in scale and complexity, the challenge is no longer just visibility. It is understanding.
Teams are not struggling to see what is happening. They are struggling to understand what it means, who should act, and how it impacts the wider system and business.
This is where the gap exists.
CloudPilot addresses this by connecting monitoring signals with ownership, cost, dependencies and operational context, enabling teams to move from detection to informed action.
By bringing these elements together, organisations can reduce response times, improve accountability and make clearer, more confident decisions during critical moments.
Monitoring tells you something is wrong. CloudPilot helps you understand what it means and what to do next.